
.png)
Top 10 Cloud FP&A Tools for Companies with $1M–$100+M ARR (2025 Edition)
As your company grows past $1M in ARR, managing financial planning in spreadsheets alone becomes a liability. Forecasting breaks. Version control fails. You lose time consolidating data instead of acting on it. That’s when FP&A software becomes not just a “nice-to-have” — but a strategic advantage.
This guide is written for founders, CFOs, controllers, and FP&A leaders at scaling SaaS, tech, services, and product companies in the $1M to $100M ARR range. Whether you’re building your first forecast or running complex scenario models for the board, choosing the right planning tool can unlock massive efficiency, deeper insights, and cross-functional alignment.
We’ve gone deep on the top 10 cloud-based FP&A tools in 2025 — detailing what each platform does, how it integrates, what it costs, who it’s best for, and where it falls short. If you're tired of duct-taping spreadsheets and want a clear view of your company’s financial future, this guide is for you.
1. Workday Adaptive Planning (formerly Adaptive Insights)
Overview:
Workday Adaptive Planning is a mature, enterprise-grade cloud FP&A and corporate performance management platform built to replace manual spreadsheet processes with scalable, automated budgeting, forecasting, and modeling. Now part of the broader Workday ecosystem, Adaptive Planning helps finance teams collaborate in real time and run powerful what-if scenarios across departments. It’s especially suited for larger mid-market to enterprise companies needing multi-dimensional planning, workforce planning, and sales planning in one integrated tool. The interface, while not spreadsheet-based, supports sophisticated modeling and approval workflows — and is backed by Workday’s reputation for reliability, auditability, and enterprise-grade security.
Official Website:
https://www.workday.com/en-us/products/adaptive-planning/overview.html
G2 Rating & Reviews:
Adaptive Planning holds a G2 rating of 4.3 out of 5. Finance professionals consistently praise its modeling flexibility, security controls, and collaborative planning capabilities. One user commented, “Adaptive has changed the way we forecast. We can iterate quickly, collaborate across teams, and analyze multiple scenarios without sending spreadsheets back and forth.” That said, some reviews mention a steeper learning curve — especially for non-finance users — and note that more advanced features (e.g. complex allocation logic) may require consulting support or significant training. A recurring theme: power users thrive, but casual users may struggle initially.
Notable Customer Testimonial:
“Workday Adaptive Planning has transformed how we do budgeting. We can collaborate across departments in real-time and run what-if scenarios on the fly, which was impossible in spreadsheets,” says the CFO of a mid-sized technology company (from a Workday case study).
Pricing:
Pricing for Adaptive Planning is not publicly listed and is offered via custom quote. Costs vary based on modules (e.g. planning only vs. planning + consolidation), number of users, and implementation needs. Industry estimates suggest pricing starts around $30,000 to $50,000 annually for mid-market customers, with higher ranges for enterprise deployments. Implementation services are typically sold separately and may involve certified Workday partners.
Supported Integrations:
Adaptive Planning offers robust data integrations, especially for customers also using Workday Financials or Workday HCM. Native connectors exist for NetSuite, Oracle, SAP, Microsoft Dynamics, QuickBooks, Salesforce, and more. Adaptive also supports custom API integrations and flat-file imports. Most enterprise users connect Adaptive to their ERP, HRIS, and CRM systems to pull in actuals and operational drivers, with updates automated on a daily or weekly basis.
Key FP&A Features:
- Multi-dimensional planning models: Model revenue, expense, headcount, and balance sheet across departments, entities, regions, products, etc.
- Scenario & version management: Build and compare multiple what-if versions in real time.
- Workforce & sales planning modules: Extend core planning with purpose-built modules for HR and sales planning (e.g., quotas, territories, compensation).
- Dashboards and reporting: Drag-and-drop dashboards and variance reports with dynamic filters and drill-downs.
- Collaboration & workflow: Role-based input sheets, approval chains, audit trails, and locking to ensure process integrity.
Financial consolidation (optional module): For multi-entity orgs needing currency conversion, intercompany eliminations, and close acceleration.
Industry Focus:
Adaptive Planning is used across tech, healthcare, education, financial services, manufacturing, and nonprofit sectors. It's especially effective for organizations with more than 200 employees and multiple departments/entities, where collaboration, version control, and long-range modeling are critical. Not ideal for small startups or companies without a dedicated finance function — the learning curve and implementation lift make it better suited to teams with structured FP&A practices.
Pros:
- Highly scalable, flexible modeling engine suitable for enterprise needs.
- Built-in modules for workforce, sales, and revenue planning.
- Real-time collaboration across finance and business units.
- Strong integration with ERP/CRM/HR systems, especially Workday.
- Mature platform with thousands of deployments and a proven track record.
Cons:
- Custom pricing and significant upfront cost make it inaccessible for smaller companies.
- Steep learning curve for non-finance or first-time FP&A users.
- Implementation may take 3–6 months, especially for complex use cases.
- Heavy customization sometimes needed to replicate highly specific spreadsheet logic.
- User interface is powerful but lacks spreadsheet familiarity — not built around Excel.

2. Planful (formerly Host Analytics)
Overview:
Planful is a cloud-native FP&A platform focused on automating core finance functions like budgeting, forecasting, financial consolidation, and management reporting. It positions itself as a “Continuous Planning” solution — one that supports both structured financial processes (e.g. annual budgeting and close) and dynamic forecasting (e.g. rolling forecasts, scenario analysis). Planful offers a strong Excel integration (via its “OfficeConnect” add-in), enabling finance teams to retain familiar workflows while tapping into the scalability of a centralized cloud engine. It's designed for mid-sized to large companies looking to improve agility, eliminate spreadsheet chaos, and accelerate cycle times.
Official Website:
https://www.planful.com
G2 Rating & Reviews:
Planful earns a 4.5 out of 5 G2 rating. Reviewers frequently highlight its ease of use, especially once the system is implemented, and the strength of its Excel-based reporting tools. One user noted, “Planful’s OfficeConnect makes building board decks in Excel or PowerPoint feel effortless — it’s linked to our source data and updates in seconds.” That said, some reviews mention quirks in interface navigation and note that the user experience can feel disjointed unless well-configured. Another common critique: while Planful offers many modules, some don’t connect seamlessly without extra setup.
Notable Customer Testimonial:
“Using Planful, our finance team cut our budget cycle by weeks. We can easily consolidate global financials and generate reports in minutes, not days. The ability to drill into data and run what-if scenarios has really improved our agility,” says the VP of Finance at a manufacturing firm (from a Planful case study).
Pricing:
Planful uses custom pricing based on company size, number of users, selected modules (e.g. consolidation, planning, reporting), and required support. Industry sources estimate entry-level packages start at approximately $1,250/month, but that figure can rise significantly for larger teams or those needing consolidation capabilities. Most customers receive a tailored quote after a discovery process. Implementation services are often required and priced separately, typically via Planful or a certified partner.
Supported Integrations:
Planful boasts a wide integration ecosystem with pre-built connectors for ERPs (NetSuite, Microsoft Dynamics, Intacct, QuickBooks), CRMs (Salesforce), HRIS systems (Workday, BambooHR), and other data sources. Integration tools like Boomi or direct API connections allow data syncing and automation. Excel, Word, and PowerPoint are tightly integrated via the Planful OfficeConnect add-in, allowing real-time refresh of data in reports and decks.
Key FP&A Features:
- Budgeting & Forecasting: Supports top-down, bottom-up, zero-based budgeting. Enables templates with roll-up logic and driver-based modeling.
- Scenario Management: Create side-by-side versions (e.g. Base Case, Worst Case) and compare across time and business dimensions.
- Financial Consolidation: Multi-entity consolidation module handles intercompany eliminations, currency conversion, and close automation.
- Reporting & Dashboards: Report builder and dashboard tool allow financial, operational, and KPI reports with drill-down functionality.
- Workflow & Approvals: Built-in process management with task assignments, status tracking, and audit trails across departments.
- OfficeConnect: Sync Excel, Word, and PowerPoint files directly to Planful for auto-updating board decks, reports, and narratives.
Industry Focus:
Planful is especially popular with mid-market companies (typically $20M–$500M revenue) across industries such as SaaS, manufacturing, services, and healthcare. Companies with distributed teams and structured planning cycles benefit from its collaborative features. It's a strong fit for organizations that want to modernize FP&A processes while still leveraging Excel workflows. Less suited for very small teams or companies without FP&A experience — the platform assumes some finance process maturity.
Pros:
- Excellent Excel/Office integration makes reporting seamless for finance teams.
- End-to-end solution covering planning, close, consolidation, and reporting.
- Strong scenario modeling and rolling forecast support.
- Designed for finance professionals — minimal IT reliance for ongoing use.
- Scalable as companies grow in complexity (entities, users, models).
Cons:
- Initial setup can take weeks to months depending on modules and data readiness.
- Interface has quirks — some modules don’t integrate as intuitively as others.
- Not a pure spreadsheet modeler — some flexibility is traded for structure.
- Advanced use cases (e.g. capital planning, custom allocations) may need support or customization.
- Pricing grows quickly with user count and module expansion.

3. Vena Solutions
Overview:
Vena is a powerful FP&A platform that combines the familiarity of Excel with the benefits of a centralized, cloud-based planning engine. Rather than replacing spreadsheets, Vena enhances them — offering version control, audit trails, workflow automation, and centralized data management while allowing users to keep building models and reports in Excel. This hybrid approach makes Vena especially attractive to finance teams that already have deep Excel expertise but need to scale their processes beyond disconnected files and manual consolidation. It’s ideal for companies with complex reporting needs, multiple stakeholders, and long budgeting cycles that want control without abandoning Excel.
Official Website:
https://www.venasolutions.com
G2 Rating & Reviews:
Vena earns a strong 4.6 out of 5 rating on G2. Reviewers frequently praise its Excel-native interface, which dramatically reduces training time and encourages adoption among finance professionals. One customer noted, “Because it’s built on Excel, we didn’t have to relearn how to plan — we just plugged our models into Vena and started getting value.” Users also cite time savings in reporting and planning workflows. However, some reviews mention longer-than-expected implementations, and that configuring templates, security roles, and data mapping requires careful setup. Also, while intuitive to Excel users, those unfamiliar with Excel may find Vena less friendly.
Notable Customer Testimonial:
“Vena turned our thousands of spreadsheets into a single source of truth. Our budgeting process went from a 3-month ordeal to a few weeks. We cut out so many manual steps — Vena’s Excel interface meant our team needed minimal training to start creating reports and forecasts,” said the Finance Director of a healthcare company (from Vena’s site).
Pricing:
Vena uses custom pricing based on company size, user count, features, and implementation scope. It offers Professional and Complete packages. Industry sources report first-year costs (including services) often exceed $60,000, with lower annual renewals thereafter. Smaller nonprofits may qualify for discounts. The investment is typically justified by time savings and control gained, but pricing is generally aligned with mid-market and enterprise budgets. Implementation is typically handled via Vena partners or internal services.
Supported Integrations:
Vena integrates with major ERP and accounting systems (e.g. NetSuite, Intacct, Microsoft Dynamics, QuickBooks), CRMs (Salesforce), HRIS platforms (Workday, BambooHR, ADP), and data warehouses (Snowflake, Power BI). Excel data is synced via the Vena add-in, enabling two-way data flow between the spreadsheet and the cloud platform. Vena also provides flat-file imports and API support for custom integrations. Its tight integration with Power BI enables sophisticated visual dashboards on top of FP&A data.
Key FP&A Features:
- Excel Interface + Central Database: Users build and use templates in Excel with Vena’s add-in. Inputs, reports, and models are connected to a secure cloud database with user permissions, validations, and versioning.
- Budgeting & Forecasting: Supports all budgeting methodologies. Versions (e.g. Budget, Forecast, Scenario A) can be stored and compared. Templates are customizable to fit company-specific planning needs.
- Workflow Management: Budget tasks can be assigned to contributors with deadlines and approvals. Users receive notifications, and admins can monitor progress in real time.
- Reporting & Dashboards: Build Excel-based reports that refresh with a click. Vena also offers web-based dashboards and drill-down views, especially when integrated with Power BI.
- Scenario Analysis: Duplicate any plan and change key drivers to create multiple what-if scenarios. Excel flexibility allows nearly unlimited modeling logic.
- Financial Close & Reconciliation: Modules for account reconciliations, financial close checklists, and audit support. Helps streamline actuals input and closing processes.
- Audit Trails & Permissions: All data changes are tracked (who, what, when), and admins can set granular access controls to limit visibility by department, user role, or function.
- AI Assistant (Vena Insights): Newer feature that allows users to ask natural language questions about their data (“What caused OPEX variance in Q2?”) and receive narrative + visual responses.
Industry Focus:
Vena targets mid-sized and large enterprises, especially those with heavy Excel usage and multi-departmental collaboration. It’s widely used in industries like healthcare, manufacturing, higher education, consumer goods, and financial services, where regulatory or organizational complexity demands control and auditability. It’s also a fit for companies that value template-driven planning and prefer to build within familiar Excel interfaces rather than adopting a new modeling UI.
Pros:
- Excel-first design = rapid adoption and low training burden.
- Centralized, auditable data repository with strong controls.
- Excellent for companies transitioning from chaotic spreadsheet models to structured processes.
- Deep template library and strong partner ecosystem for implementation.
- Tight integration with Power BI for high-end dashboards.
- Supports full FP&A stack: budgeting, forecasting, reporting, workflow, and financial close.
Cons:
- High implementation cost and long onboarding cycles (often 3–6+ months).
- Complex setups may require Excel experts and Vena-specific configuration knowledge.
- Expensive for small companies; best suited to orgs with mature finance teams.
- Large Excel templates can load slowly or require performance tuning.
- While powerful, it can feel “Excel-heavy” for users preferring modern, web-based UI tools.
- Some limitations in operational or non-finance planning (e.g., no dedicated sales capacity planning module).

4. Datarails
Overview:
Datarails is an FP&A platform purpose-built for small to mid-sized businesses (SMBs) that rely heavily on Excel. Instead of forcing companies to abandon spreadsheets, Datarails wraps automation, data consolidation, and real-time reporting capabilities around the finance team’s existing models. It pulls data from various sources into a centralized database, eliminating manual consolidation, versioning issues, and static reports — while allowing users to keep building budgets, forecasts, and dashboards in Excel. Datarails markets itself as “Excel, but with superpowers,” making it particularly attractive for lean finance teams that want faster planning cycles without learning a new interface.
Official Website:
https://www.datarails.com
G2 Rating & Reviews:
Datarails scores a stellar 4.8 out of 5 on G2. Users consistently praise the fast implementation, minimal disruption to existing workflows, and the automation of monthly reporting and budget vs. actuals. One reviewer wrote, “We saved dozens of hours each month — Datarails turned our Excel budget mess into a reliable single source of truth.” FP&A teams also love the version control, scenario comparison tools, and the AI chatbot (FP&A Genius) that can quickly surface key financial insights. On the downside, some users feel that dashboarding and visualization tools are limited compared to full BI platforms like Power BI or Tableau.
Notable Customer Testimonial:
“I look at the insights in Datarails every single day. That’s how I know how we’re doing on sales, on revenue, and I can look at trends to forecast what’s going to happen in the future,” said Rob A., CFO of Bedrock Quartz. (from Datarails’ site)
Pricing:
Datarails does not list public pricing. Industry reports suggest typical pricing starts around $24,000/year, with most customers spending $25K–$35K/year depending on features, users, and data complexity. The company positions itself as an affordable option for teams that need enterprise-level control but can’t afford tools like Adaptive or Vena. Implementation is typically handled by Datarails and is described as weeks, not months — often with minimal consulting cost.
Supported Integrations:
Datarails supports over 200 integrations, including core finance systems (QuickBooks, Xero, NetSuite, Sage Intacct), CRMs (Salesforce, HubSpot), HR tools (BambooHR, Gusto), and data sources like Excel and Google Sheets. It can also import CSVs and connects to databases or custom systems via API. The platform’s key integration feature is its Excel plug-in, which syncs Excel files with live, centralized data — meaning models update automatically and outputs are always current.
Key FP&A Features:
- Excel Model Integration: Keep existing spreadsheets and models, but link them to Datarails’ centralized database. Changes in actuals or assumptions flow through models automatically.
- Data Consolidation: Combine multiple Excel files and data sources into a single planning model with no copy/pasting or email chains.
- Version Control: Store and compare different versions of budgets, forecasts, or scenarios. All versions are timestamped and can be rolled back or compared side-by-side.
- Reporting Automation: Automatically generate monthly board reports, budget vs. actuals, and KPI reports with refreshed data.
- Scenario Planning: Duplicate forecasts with new assumptions and model the impact on P&L, cash, and other metrics.
- FP&A Genius: AI-powered assistant that can answer questions about financials in natural language (“What was our revenue variance in Q3?”).
- Access Controls & Collaboration: Assign departmental ownership, lock cells, and manage approvals while ensuring data integrity.
Industry Focus:
Datarails is targeted at finance teams in the $1M–$50M ARR range across verticals like SaaS, services, healthcare, and nonprofit. Its sweet spot is companies that have outgrown raw Excel but don’t need or want a full enterprise EPM system. It’s also a strong fit for fractional CFOs and outsourced finance teams, who manage multiple clients and need fast, repeatable FP&A workflows without building from scratch each time.
Pros:
- Retains Excel’s flexibility while solving consolidation and versioning headaches.
- Fast implementation, low training burden, and affordable for most SMBs.
- Excellent AI assistant for insights, anomaly detection, and commentary.
- Clear ROI: saves dozens of hours per month in reporting and forecasting work.
- Very intuitive for finance professionals — no coding or scripting needed.
- Great for companies with minimal IT resources or no FP&A headcount.
Cons:
- Limited dashboarding compared to full BI tools — visual analytics are good, not great.
- Not ideal for companies seeking to migrate away from Excel — it embraces Excel, doesn’t replace it.
- May lack advanced modules (e.g. capital expenditure planning, long-range planning UI).
- Scaling to very large datasets or complex multi-entity structures may reveal limitations.
- Still evolving in terms of workflow approvals and advanced process management (not as granular as tools like Planful or Vena).
- May require clean-up of poorly designed Excel models before connecting.

5. Cube
Overview:
Cube is a cloud-based FP&A platform designed to enhance, not replace, the spreadsheet experience. It’s built for finance teams that want the flexibility of Excel or Google Sheets combined with the power of a centralized data model, real-time collaboration, and integrations across their tech stack. Cube positions itself as the “spreadsheet-native FP&A platform,” enabling teams to plan, analyze, and collaborate in either Cube’s web interface or directly in Excel/Sheets. This dual-mode approach makes Cube especially popular with fast-scaling mid-market companies that want modern financial infrastructure without giving up the tools they know.
Official Website:
https://www.cubesoftware.com
G2 Rating & Reviews:
Cube holds a 4.5 out of 5 rating on G2. Users praise its ease of use, speed to implement, and tight integration with spreadsheets. One G2 reviewer noted that “Cube functions as a more logic-driven Excel — it made a lot of sense once we saw how the formulas synced with our model.” Reviews highlight how Cube helps finance teams quickly move away from manual consolidations and error-prone formulas. On the downside, some users say that as model complexity increases (with many dimensions), performance or setup can become more delicate. Others note that Cube works best for teams (not individuals) — it’s not built for solo operators or microbusinesses.
Notable Customer Testimonial:
“Cube gave us enterprise-level planning without the headache. Our finance team was up and running in a few weeks. Now we spend less time consolidating data and more time on strategy. I especially love that I can drill down from a summary number in a Google Sheet all the way to a transaction detail from our ERP in seconds,” says the VP Finance of a SaaS company (from Cube’s website).
Pricing:
Cube’s pricing is relatively transparent. Plans start around $2,000/month for a standard package (including core FP&A functionality and a fixed number of users). Larger teams, or those needing more integrations and advanced features, may be quoted significantly more (often in the $25K–$60K/year range). Cube emphasizes fast time-to-value — customers are often fully live within weeks, without needing external consultants, which keeps total cost of ownership lower than traditional EPM tools.
Supported Integrations:
Cube integrates natively with Excel, Google Sheets, and common accounting/ERP systems like NetSuite, Sage Intacct, QuickBooks, Xero, Salesforce, and Workday. It also connects to Snowflake, Redshift, and other data warehouses. An open API and SQL connectors enable custom integrations. Cube’s approach is “bring your own spreadsheet as front-end and connect to any source for back-end data,” so even if something isn’t available natively, customers can use API or flat file methods to sync.
Key FP&A Features:
- Two-Way Excel/Sheets Add-In: Users can pull Cube data into Excel or Sheets via functions (e.g., CUBE.VALUE) and also push data back with a single click. This keeps spreadsheet workflows alive, but with real-time data control and security.
- Centralized Multi-Dimensional Model: Cube stores all data in a centralized calculation engine with dimensions (e.g., accounts, departments, time, products), enabling flexible slicing, dicing, and analysis across the business.
- Templates & Reports: Build or reuse templates for board reporting, variance analysis, forecast updates, and more — all refreshed automatically with live data from Cube.
- Scenario Management: Easily toggle between scenarios (Budget, Forecast, Plan A, Plan B) with version control and side-by-side comparisons.
- Driver-Based Planning: Set up logic such as “Revenue = Price x Volume” or “Travel = $X per employee,” with the ability to link spreadsheet drivers to the centralized Cube model.
- Dashboards: Cube’s web interface includes dashboarding tools for visual reporting and executive views — ideal for non-finance stakeholders.
- Access Controls & Audit Trails: Limit access by user role, department, or template. Cube tracks who made what change and when, supporting SOX compliance and accountability.
- Error Checking & Validations: Prevents input mistakes by enforcing logic rules (e.g., totals must match, no negative headcount, etc.).
- Quick Implementation Tools: Includes account mapping, data import templates, and guided setup for fast deployment.
Industry Focus:
Cube targets mid-market companies, especially high-growth organizations in SaaS, services, professional firms, and nonprofits. It’s particularly useful for teams that are graduating from Excel chaos, but don’t want to invest in a heavyweight EPM tool. Typical users include finance teams of 2–10 people, at companies with $10M–$500M in ARR. Cube is not aimed at freelancers or very small businesses, and while it can support larger orgs, companies with Fortune 1000-level complexity may require deeper enterprise solutions like Anaplan.
Pros:
- Familiar spreadsheet interface = low learning curve.
- Centralized logic and real-time updates reduce errors and time wasted consolidating data.
- Supports rapid modeling, budgeting, and re-forecasting.
- Fast implementation — live in weeks, not months.
- Strong customer support and onboarding team.
- Works across departments — not limited to finance (used for sales, HR, and headcount planning too).
- API and flexible data model mean it scales with your tech stack.
Cons:
- Complex multi-dimensional models require thoughtful setup — performance can degrade if not structured properly.
- Not as many pre-built modules (e.g., no plug-and-play capital planning or close module — you’ll build your own).
- Lacks robust long-range planning UX (no separate 10-year planning UI — it’s all in templates).
Approval workflows are light — it’s not a full process management system like Oracle or SAP BPC. - Not a great fit for solo users or very small businesses — Cube assumes a team-based planning environment.
- Training materials are lighter than older tools — more guided onboarding, less traditional documentation.

6. Jirav
Overview:
Jirav is a cloud-native FP&A platform designed specifically for small and medium-sized businesses (SMBs) and outsourced accounting/CFO firms. It offers an all-in-one platform for planning, forecasting, reporting, and dashboarding, with a simple web interface and a pre-built financial model covering P&L, balance sheet, and cash flow. Jirav is ideal for teams that want to move away from spreadsheets but don’t have the time or resources for large-scale implementations. It provides a fast, structured way to create driver-based financial forecasts, rolling budgets, and collaborative department-level planning — all without needing to know advanced Excel modeling.
Official Website:
https://www.jirav.com
G2 Rating & Reviews:
Jirav holds a 4.7 out of 5 rating on G2. Users frequently describe it as intuitive, quick to set up, and easy to maintain. One reviewer shared: “Forecasting used to be a nightmare of Excel links — now Jirav updates in minutes and we can answer questions in real-time.” The visual dashboards, integration with QuickBooks, and support for rolling forecasts are all called out as strengths. On the downside, users at larger or multi-entity companies say that Jirav can feel limiting in terms of modeling complexity or performance when datasets get too large.
Notable Customer Testimonial:
“Jirav has been a game changer for our finance team. In the past, forecasting was a nightmare of linked spreadsheets. Now, actuals from QuickBooks flow in automatically and updating our forecast is as simple as tweaking a few drivers. The scenario analysis and dashboards help us tell a clear story to leadership every month,” — Controller at a tech startup (from a Jirav case study).
Pricing:
Jirav publishes ballpark pricing.
- Starter plan: ~$10,000/year
- Pro plan: ~$15,000/year
- Enterprise plan: custom-quoted
Plans differ based on number of users, scenarios, and planning entities. Jirav also offers wholesale pricing for accounting firms and fractional CFOs managing multiple clients. A free demo and trial are typically offered. Compared to most FP&A software, Jirav is on the affordable end, especially when factoring in the speed of implementation and support included.
Supported Integrations:
Jirav integrates with:
- Accounting/ERP: QuickBooks Online, QuickBooks Desktop, Xero, NetSuite
- HRIS/Payroll: Gusto, ADP, BambooHR, Paychex, Namely
- CRM: Salesforce, HubSpot
- Billing: Stripe
- Other: Excel, Google Sheets, MySQL, Redshift, Snowflake (custom data)
Most integrations are plug-and-play, and setup is guided with built-in connectors. Data syncs automatically from systems like QuickBooks and Gusto, eliminating the need for manual imports.
Key FP&A Features:
- Pre-built Financial Model: Includes income statement, balance sheet, and cash flow forecasting out of the box. This structure reduces the time to build models from scratch.
- Driver-Based Planning: Model revenue, COGS, and expenses using assumptions like units sold, pricing, headcount, and more. You can build custom drivers using “custom tables” (e.g., for SaaS cohorts or bookings).
- Rolling Forecasting: Replace static budgets with rolling 12- or 18-month forecasts that blend actuals and projections in real time.
- Scenario Planning: Clone plans to model best/worst/mid-case scenarios. Easily toggle between them for comparison in dashboards and reports.
- Dashboards & Reports: Interactive, client-ready dashboards for metrics like revenue, headcount, and cash runway. Reports can be exported or presented in-app using “presentation mode.”
- Workforce Planning: Forecast at employee or role level using imported HR data. Useful for payroll projections and headcount cost modeling.
- Collaboration & Permissions: Assign planning responsibilities by department. Control access to models and dashboards by role.
- Financial Ratios & KPI Library: Comes with built-in SaaS metrics (e.g., gross margin %, CAC, runway) and lets you create custom metrics.
- Presentation Mode: Enables easy export and board-level storytelling from inside the app.
Industry Focus:
Jirav is built for SMBs, early-stage tech startups, agencies, nonprofits, and fractional CFOs/accounting firms. Companies that use QuickBooks or Xero are a perfect match. Jirav is not geared toward massive enterprise planning, but it excels in helping small finance teams gain speed, control, and clarity without complex setups. For accounting firms, Jirav’s multi-client support and pricing make it an attractive platform for offering managed FP&A services.
Pros:
- Extremely fast to implement — up and running in days to weeks.
- Pre-built financial model eliminates need for starting from scratch.
- Strong native integrations with popular SMB tools.
- Modern UI with intuitive dashboards and report sharing.
- Affordable price point for funded startups and lean teams.
- Great support and onboarding — frequently cited by users as a strength.
- Well-suited for fractional CFOs managing multiple clients.
Cons:
- Less flexible than Excel-based tools — custom logic may be hard to implement.
- Performance can lag with very large models or datasets.
- Limited for complex multi-entity consolidations or intercompany logic.
- Fewer out-of-the-box integrations than tools like Planful or Vena.
- Lacks a deep approval workflow or audit tracking for SOX-style compliance.
- Not ideal for advanced long-range modeling or big enterprise requirements.

7. Mosaic
Overview:
Mosaic is a Strategic Finance Platform that merges traditional FP&A with real-time analytics, designed for high-growth companies, particularly in SaaS, FinTech, and tech-enabled services. Mosaic goes beyond budgeting and forecasting — it brings together financial, operational, and CRM data into a unified interface, empowering finance teams to become strategic partners across the business. Unlike traditional EPMs or spreadsheet-driven models, Mosaic offers out-of-the-box metrics, real-time dashboards, automated reporting, and collaborative planning tools, all in a modern UI built for scale.
Mosaic describes its mission as “helping finance teams become storytellers, not spreadsheet jockeys” — meaning it’s as much about insight and communication as it is about calculations. It’s best for teams ready to move beyond Excel and connect systems like NetSuite, Salesforce, and Workday into one centralized planning and analytics hub.
Official Website:
https://www.mosaic.tech
G2 Rating & Reviews:
Mosaic has a 4.7 out of 5 G2 rating. Users frequently praise its modern design, real-time dashboards, and strong integrations. A consistent theme is Mosaic’s ability to deliver insight “without needing to build every formula” — finance teams can quickly explore SaaS metrics, departmental spend, and forecasts all in one place. One reviewer wrote, “Mosaic feels like having a finance command center — I can answer CEO questions in minutes with actual data.” Downsides include longer implementation times than lighter tools and the fact that Mosaic’s templates are SaaS-centric, which may limit its usefulness for companies outside that model.
Notable Customer Testimonial:
“With Mosaic, we have one place to see all our SaaS metrics, track our budget vs. actual, and model scenarios for fundraising. It’s like having a finance command center — I can answer the CEO’s questions in minutes with real data. It has made finance truly strategic here,” — VP Finance, Enboarder (from Mosaic’s case studies).
Pricing:
Mosaic pricing is custom-quoted based on company size, user count, integrations, and features. Industry estimates place typical packages in the $30,000–$60,000/year range, depending on scale. Mosaic doesn’t offer a self-serve plan — instead, customers go through a sales-led process including a demo, scoping call, and implementation timeline. Mosaic emphasizes ROI through time savings and better planning accuracy — often reducing manual reporting time from days to hours.
Supported Integrations:
Mosaic integrates with 30+ major tools across finance, HR, sales, and operations. Notables include:
- ERP/Accounting: NetSuite, QuickBooks, Sage Intacct, Xero
- CRM: Salesforce, HubSpot
- Billing: Stripe, Chargebee, Zuora, Maxio
- HRIS: Workday, BambooHR, Gusto, ADP, Namely
- Data Warehouses: Snowflake, BigQuery, Redshift
- Other: Custom APIs, SFTP, Excel exports (but no Excel push/pull modeling)
Mosaic centralizes data from all sources into its platform, creating a real-time reporting environment where teams can track KPIs, model plans, and run scenario analyses without manual data prep.
Key FP&A Features:
- Live Dashboards & Metric Library: 125+ prebuilt metrics (e.g., ARR, gross churn, CAC payback) for SaaS and recurring revenue businesses. Dashboards update as source data changes.
- Driver-Based Planning: Build budgets and forecasts using key business drivers — e.g., hiring plans, pipeline coverage, or usage metrics — with automatic roll-ups into financial statements.
- Scenario Modeling: Create and compare Plan A/B/C scenarios, update assumptions, and analyze P&L or cash flow impacts instantly.
- Headcount Planning: Model new hires with ramp time, salary, and benefits; see impacts on cash, department budgets, and metrics like revenue per employee.
- Collaboration & Approvals: Assign plan ownership to department heads, enable cross-functional inputs, and track approvals.
- Board-Ready Reporting: Narrative storytelling tools with charts, callouts, and KPIs tailored to exec and board-level stakeholders.
- Variance & Trend Analysis: Monitor actuals vs. budget/forecast at all times with drill-downs to transaction-level data.
- Operational Analytics: Mosaic brings in CRM and product usage data to link pipeline health, conversion rates, and usage to revenue forecasts.
Industry Focus:
Mosaic was born in the VC-backed SaaS ecosystem, and it shows. Its templates and metrics cater to recurring revenue models, subscription analytics, and fast-scaling teams. However, it is expanding to serve other industries like eCommerce, FinTech, and marketplaces that have similar planning needs and system architectures. Ideal users are mid-sized to large startups with $10M–$200M ARR, multi-system data environments, and a desire for real-time, connected insights.
Pros:
- Modern, real-time dashboards designed for finance and non-finance users.
- SaaS metrics out-of-the-box — no need to build LTV, CAC, or ARR logic from scratch.
- Deep integrations with systems across the finance stack (ERP, CRM, HRIS, billing).
- Enables collaborative planning with department heads contributing directly to the model.
- Transforms finance into a strategic function — storytelling, not just spreadsheets.
- Replaces need for separate BI tools for financial and operational metrics.
Cons:
- No Excel-based modeling — users must adapt to Mosaic’s web UI and formula logic.
- Best suited for SaaS/tech — non-SaaS firms may not benefit from all features.
- Implementation can take 6–12 weeks depending on data complexity.
- Expensive relative to simpler FP&A tools — better fit for companies with scale.
- Requires mapping across systems — setup takes effort and ongoing upkeep.
- Custom metric logic (e.g., defining CAC differently) may require workaround.

8. Finmark, from BILL
Overview:
Finmark is a purpose-built FP&A tool for startups and early-stage businesses, designed to simplify financial modeling without requiring advanced Excel skills. Acquired by BILL in 2022, Finmark positions itself as the startup-friendly alternative to traditional, complex FP&A platforms. It offers intuitive planning for headcount, runway, revenue, and expenses, with a clean UI and step-by-step guided workflows.
Finmark is especially popular among Seed to Series B SaaS companies looking to ditch static spreadsheets for a living model they can use in board meetings, investor updates, and strategic planning. The platform is streamlined — not overloaded with enterprise features — and focuses on delivering clarity, speed, and startup-relevant metrics like burn rate and CAC/LTV.
Official Website:
https://www.finmark.com
G2 Rating & Reviews:
Finmark has a G2 rating of 4.6 out of 5. Reviewers frequently mention that it’s perfect for non-finance founders, with minimal onboarding friction. Users appreciate the out-of-the-box templates, ease of adjusting assumptions, and simple scenario creation. One reviewer wrote, “It’s like FP&A for the rest of us — no VLOOKUPs, just good decisions.” Critiques include limited flexibility for advanced modeling and dependency on predefined modules.
Notable Customer Testimonial:
“Before Finmark, I was updating our cash forecast manually every week in Excel. Now it’s automated and accurate, and I can model scenarios for new hires or growth targets in minutes. It’s saved us hours and gives our investors more confidence,” — CEO of a Seed-stage SaaS startup (from Finmark site).
Pricing:
Finmark uses tiered pricing based on ARR and user count. Starting plans are:
- Basic: $100/month (for companies under $1M ARR)
- Growth: $300–$500/month (for companies with $1M–$10M ARR)
- Custom/Enterprise: Quote-based pricing for larger firms
Compared to other tools, Finmark is one of the most affordable options for early-stage teams. A key selling point is the ability to get strategic-level FP&A without hiring a full-time FP&A head.
Supported Integrations:
Finmark integrates with:
- Accounting/ERP: QuickBooks, Xero, NetSuite
- Payroll/HRIS: Gusto, Rippling, Justworks
- CRM: HubSpot, Salesforce
- Banking/Spending: Brex, Ramp
- Other: Excel/CSV imports, and select API connections
Data from these systems can be pulled into Finmark’s model automatically to keep actuals and forecasts aligned.
Key FP&A Features:
- Cash Flow Forecasting: Real-time visibility into runway, burn rate, and projected cash flow. You can model new funding rounds, payment terms, or delayed hiring impacts.
- Revenue Modeling: Pre-built templates for subscription, usage-based, or service-based revenue. Adjust MRR growth assumptions, churn, pricing, and more.
- Expense Planning: Input or import fixed and variable costs. Finmark lets you create logic-based expense drivers (e.g., “$X per employee”).
- Headcount Planning: Built-in workflows to plan by role, salary, start date, and benefits. Impacts forecast automatically across payroll and cash.
- Scenario Modeling: Create multiple plans for fundraising, cost cutting, or growth. Easily toggle and compare.
- Investor Reporting: Board deck exports and reporting templates tailored for investor updates (e.g., runway, burn multiple, CAC:LTV).
- Collaboration & Approvals: Assign owners to departments or budget categories and track changes or approvals.
Industry Focus:
Finmark is laser-focused on early-stage tech companies, especially SaaS startups. It’s used by founders, fractional CFOs, and lean finance teams who want a live, dynamic model but don’t want to build one from scratch in Excel. While not as powerful as enterprise tools, its simplicity is its strength for Seed to Series B companies with <150 employees and <$25M ARR.
Pros:
- Incredibly easy to use — minimal setup, intuitive UI
- Purpose-built for startups with SaaS-centric metrics and templates
- Strong focus on cash, runway, and hiring plans
- Affordable entry-level pricing
- Pre-integrated with startup tools like Gusto, Brex, Ramp
- No spreadsheet knowledge required
Cons:
- Not flexible enough for complex enterprise modeling
- Limited customization — you’re working within pre-defined logic
- Dashboards are basic — more functional than visual
- Lacks Excel integration — can export to CSV but not bi-directional
- Not ideal for multi-entity or multinational firms
- No robust consolidation or financial close features

9. Causal
Overview:
Causal is a modern FP&A tool built for dynamic modeling, scenario planning, and collaborative finance. It offers a spreadsheet-like interface combined with a powerful modeling engine that automatically handles dimensions, logic, and integrations. Unlike traditional spreadsheets, Causal is gridless—you don’t work in cells, you work with variables and dimensions, making it especially flexible for multi-scenario planning. Finance teams use it for headcount planning, SaaS forecasting, operating models, and investor reporting. Causal is geared toward startups and scaling teams who want to move fast and collaborate across functions.
Official Website:
G2 Rating & Reviews:
Causal has a G2 rating of 4.6 out of 5. Users praise the intuitive modeling interface and the ease of doing scenario comparisons. Several CFOs and startup founders note it removes spreadsheet friction and allows for rapid iteration.
Pricing:
Causal starts with a free trial and offers paid plans starting around $250/month. Pricing increases with company size, data integrations, and user count. They have Startup, Growth, and Enterprise tiers—though you’ll need to talk to sales for exact pricing over time.
Notable Customer Testimonial:
“Causal is a game-changer. We replaced five complex Excel models with one clean model in Causal. I can forecast cash, SaaS metrics, headcount, and more—all in one place,” says a Head of Finance at a Series B startup.
Supported Integrations:
- Accounting/ERP: QuickBooks, Xero, NetSuite
- HRIS: BambooHR, Gusto
- CRM: HubSpot, Salesforce
- Data Warehouses: Snowflake, BigQuery
- Custom integrations via API and CSV uploads
Key FP&A Features:
- Gridless Financial Modeling (no traditional rows/columns)
- Scenario Planning (multi-version: Base, Worst Case, Best Case, etc.)
- Driver-Based Forecasting (revenue, CAC, churn, etc.)
- Headcount Planning by Department/Role
- Cash Flow Forecasting
- SaaS Metrics (MRR, NRR, churn, CAC payback, runway)
- Google Slides export for investor decks
- Collaboration via commenting, version control, and sharing
- Audit trails and variable logic tracking
Industry Focus:
SaaS, Tech, Agencies, Marketplaces – especially companies from $1M to $30M ARR that want flexibility without legacy EPM complexity.
Pros:
- Fast onboarding: live in days
- Intuitive visual modeling
- Built-in SaaS metrics library
- Excellent for early-stage or Series A–C finance teams
- Great UX for non-finance collaborators
Cons:
- Less structured than cube/grid-based models like Adaptive or Planful
- May lack advanced permissioning for larger teams
- No Excel plug-in (by design—it’s a spreadsheet replacement)
- Not ideal for traditional finance teams that want full control in Excel
- Custom reporting requires setup—less template-driven than Vena or Planful

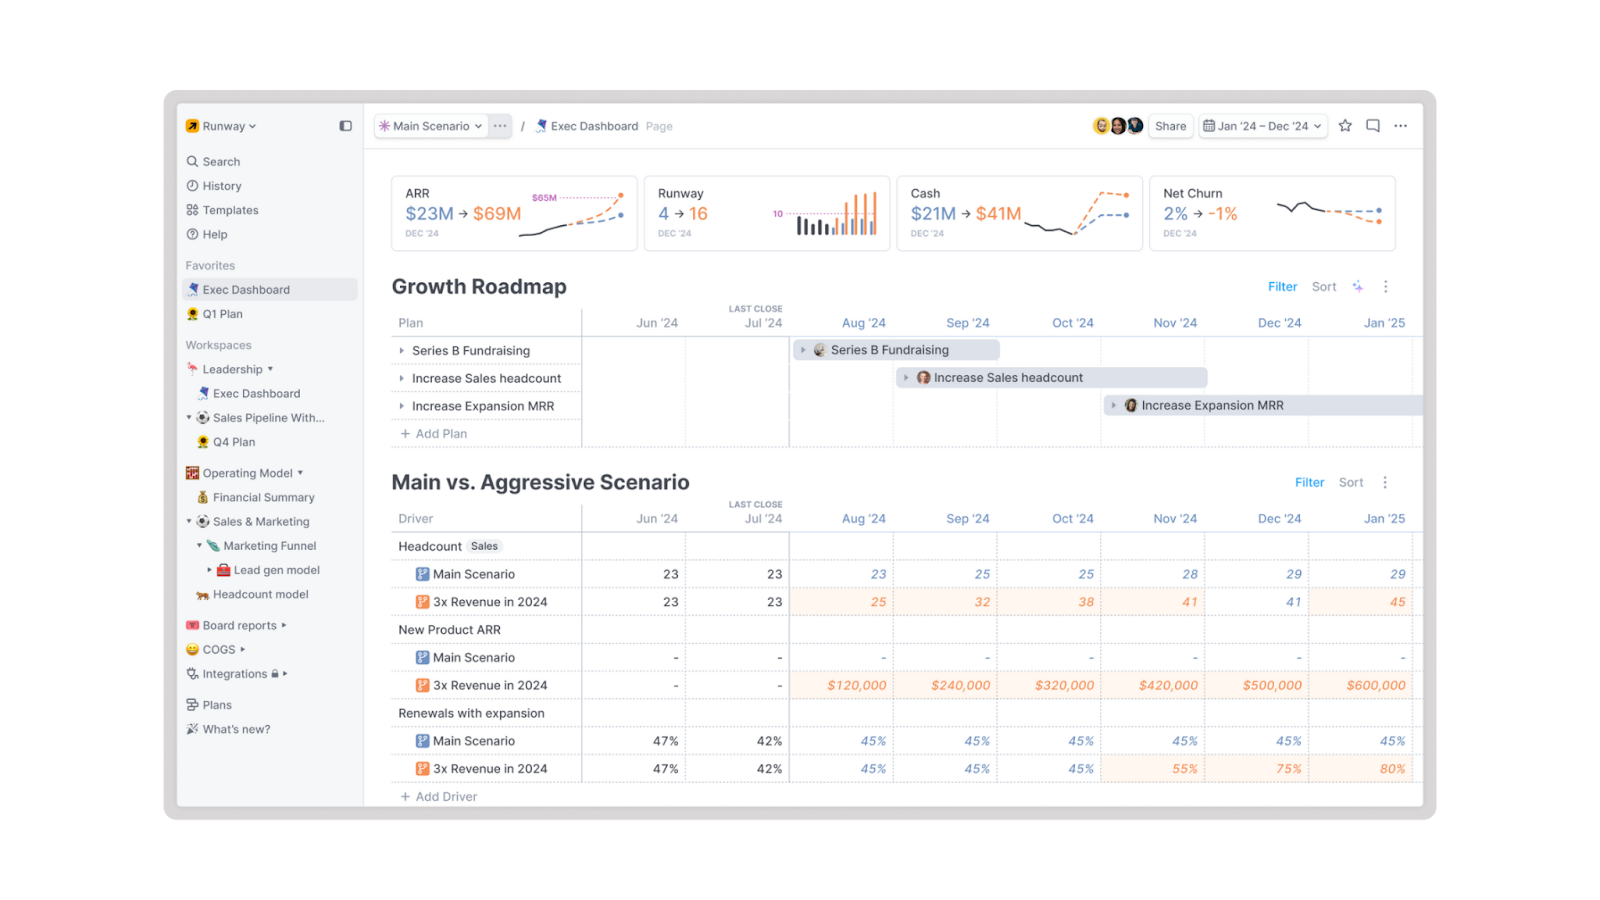
10. Runway
Overview:
Runway is a sleek, modern FP&A platform purpose-built for startups and high-growth companies looking to manage their budgets, headcount plans, and cash forecasts without drowning in spreadsheets. Designed for founders, finance leads, and ops teams, Runway emphasizes clarity, collaboration, and visual simplicity over complex, Excel-based modeling. It connects live to your accounting system and payroll provider, automatically syncing actuals to give you a living model that updates as the business evolves. It’s especially popular with companies in the $1M–$20M ARR range looking for fast time-to-value.
Official Website: https://runway.com/
G2 Rating & Reviews:
Not widely rated on G2 yet (as of 2025), but early user feedback on Substack/YC circles and pilot users has been very positive—especially regarding usability and design. It’s a newer entrant but growing quickly in the FP&A SaaS space.
Pricing:
Runway offers transparent, startup-friendly pricing starting at around $250/month, with growth-tiered plans that scale by company size and feature set. Most users fall into the $250–$750/month range. There’s no free plan, but Runway offers demos and occasionally pilot pricing for early-stage startups.
Notable Customer Testimonial:
“Our board meetings used to take a week to prepare for. Now it’s all live in Runway—budget vs. actuals, hiring plans, cash runway. It’s honestly replaced 4 spreadsheets,” said a VP of Finance at a Series A SaaS startup (testimonial from Runway’s customer library).
Supported Integrations:
- Accounting: QuickBooks, Xero
- Payroll & HR: Gusto, Rippling
- Banking: Plaid (for cash flow tracking)
- Others: CSV upload support, Google Sheets exports
- Upcoming: NetSuite and deeper BI integrations in roadmap
Key FP&A Features:
- Live Actuals Sync: Pulls data automatically from accounting and payroll systems
- Headcount Planning: Visual hiring roadmap by department/role with associated costs
- Cash Runway Forecasting: Dynamic modeling with adjustable assumptions and auto-updating runway charts
- Budget vs. Actual Tracking: Track plan vs. real-time spend in intuitive dashboards
- Scenario Modeling: Quick creation of multiple forecast scenarios (e.g., Base, Stretch, Downturn)
- Board Deck Generator: Exports financials into board-ready visuals and charts
- Department Collaboration: Assign department owners to input budgets, view forecasts, and collaborate in-platform
- Simple Modeling Logic: Unlike full-blown modeling tools, Runway focuses on easy-to-understand assumptions and UI
Industry Focus:
Primarily SaaS, marketplaces, DTC, and professional services. It’s best for Seed to Series B companies scaling toward $20M ARR with a lean finance or ops team. Particularly suited for teams who want a visual, easy-to-use interface without heavy Excel maintenance.
Pros:
- Beautiful, modern UI: Runway is one of the most well-designed FP&A tools—built for clarity, not complexity
- Very fast setup: Live in days, not weeks
- Live sync with QuickBooks/Xero and Gusto for hands-off actuals updates
- Built for collaboration: Easy to share with founders, department heads, investors
- Excellent for headcount & cash forecasting
- Pre-built charts and reports make board prep painless
Cons:
- Limited for complex financial models: No deep multi-dimensional logic or SQL-style modeling
- Not ideal for large enterprises or companies needing deep ERP integrations
- No Excel plug-in: It’s designed to replace—not augment—spreadsheets
- Still maturing: Feature depth isn’t yet at the level of tools like Cube or Planful
- Limited audit trails and user permission granularity compared to enterprise platforms
Want to see a demo?
we offer a 14-day free trial.